⚠ Exploratory Research ahead
This is a little study that explores Designer’s attitudes to steps in the design process
The idea was based on the observation that some steps are part of almost any design process while some are left out. So I wanted some data on this. In addition there were two additional hypothesis: Designs steps which are less fun are done less often and design steps in which the designer does not feel in control are less fun.
Gathering data
From books and some interviews I created a list of design steps, and created a survey. For each of the design steps I asked
- how frequently the participant does the step in design (ranging from »never« to »in every project«)
- how much fun the activities for this step in the design process are for the participant.
- how much control the participant feels to have in this step of the design process.
These attributes were rated on a 7-step scale. Higher values indicated more experienced fun, more perceived control and doing the activity more often. In a little text before the survey questions, I explained what I understood as »(not) having fun« and »(not) being in control«.
Results
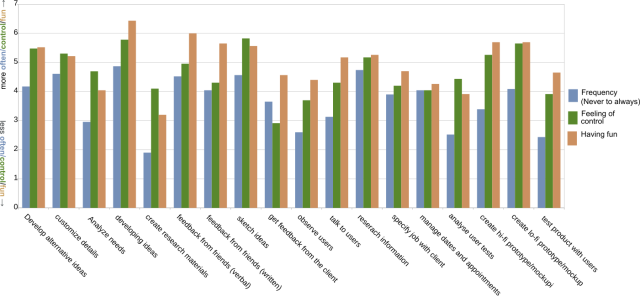 Image: Perceived control, fun and frequency for each design step
To find out how core activities of design fare compared to research activities, three Designers coded the steps as being: research, design-itself, something else¹. I created the average of the steps which were coded »design« or »research« by all three designers.
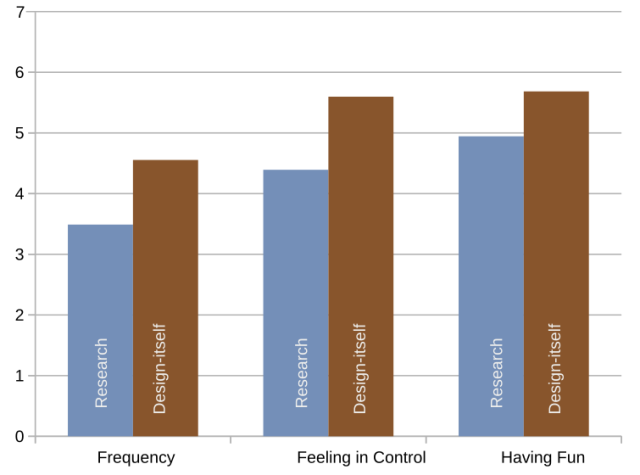 Image: Research vs. Design
Design-itself activities are done more often, seem more controllable and more fun to do. Some ideas in relation to this are using methods for research that feel more productive and controllable. Co-Design and research-by-mapping (mapping emotions and social life,describing workflows) may be ways to do this.
There is a significant correlation between control, fun and frequency – so if designers felt they are in control they had (in average) more fun and if they had more fun, they did the step more frequently.
Since the research was not experimental, we can not draw conclusions about causation here. This would need further experiments, though drawing from interviews I made with graphic designers and participants of a human centered design class, it seems to be a promising direction.
One interpretation that can be drawn is this: In design-itself-tasks, the designer feel in control of the situation and that the outcome is mainly depended on ones own actions, while in research tasks the outcome is not sure (you can ensure a scientifically sound experiment or the like, but the outcome is open).
Shortcomings
As I said the research was not experimental and explored only correlations. In addition there are some shortcomings:
- The data is based on answers of only 20 people about half being graphic designs, half being product designers.
- The order of the questions was not randomized
- The questions were ordered by the design process steps, and asked for the three attributes of a design task (Control, Fun, Frequency) in each step. If someone would choose the same rating in each of these subsequent questions (out of boredom or to complete quicker) there would be a seemingly perfect correlation.
When I continue the research I would thus
- Get a bigger sample
- get a more diverse sample
- Order by attributes as main category first, than ask for the attribute for each step. the order should be randomized.
If you are interested in doing research on the topic too, I’d be greatly interested in cooperating.
¹ »something else« was often described as »communication«.